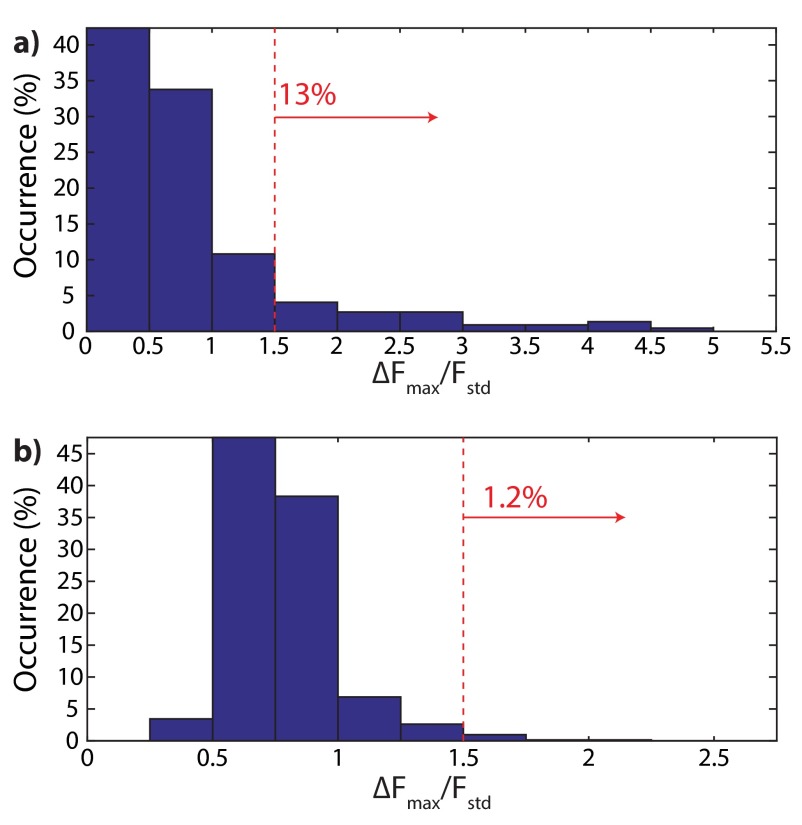
Fig. S10.
Distribution of the maximum PL change () normalized to the SD of PL () for each measured fluorescent spot in (A) hydroxylated and (B) hydrogenated NDs on 5 nm Al2O3-coated ITO electrodes. (A) For hydroxylated NDs, 13% of 222 measured fluorescent spots showed PL change larger than 1.5 . (B) For hydrogenated NDs, 1.2% of 728 measured fluorescent spots showed PL change larger than 1.5 .

