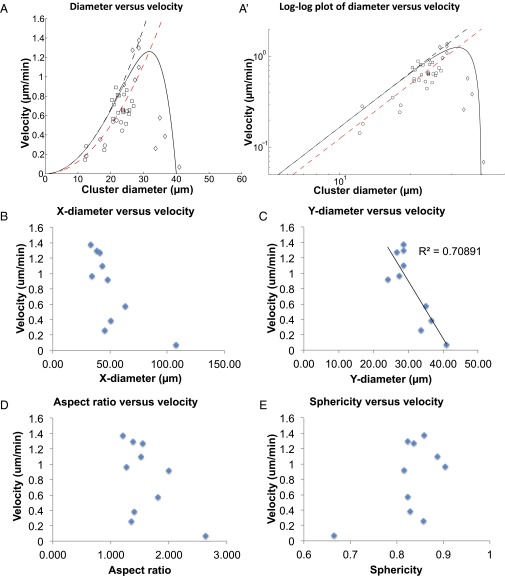
Fig. 2.
Dependence of mean cluster velocity on the cluster radius. (A) Symbols show data points averaged from different experiments: Circles, E-cadherin k.d. (UpdGal4, UAS-EcadRNAi); squares, WT; diamonds, mutant extralarge clusters. Solid black line gives the fit to Eq. 16, using , i = 6, Regg = 20 μm, β = 150 (μm⋅min). Dashed black line, , such that the effects of the confining shell are ignored. The red dashed line denotes the fit to the WT and E-cadherin k.d. data using these parameters: Regg = 26 μm, β = 200 (μm⋅min). A′ shows a log–log plot to highlight the power-law behavior of small clusters, , which indicates the dominant role of viscous drag. (B–E) Plotting x-axis diameter (B), y-axis diameter (C), aspect ratio (D), and sphericity (E) against velocity. Lines of linear regression were shown and R2 were indicated in C.

