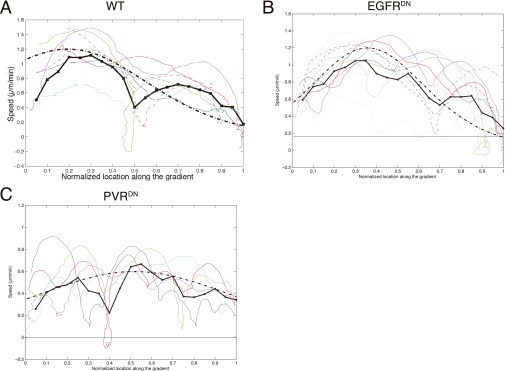
Fig. S4.
Velocity up the gradient, for several experiments. Colored lines are individual WT (A), EGFRDN (B), and PVRDN (C) experiments, averaged every five time points for smoothening. The thick black line gives the average of all of the experiments, and the thick dashed-dot black line gives the fit to Eq. 17. The peak value of the theoretical expression is normalized to velocity of 1.2 µm/min.

