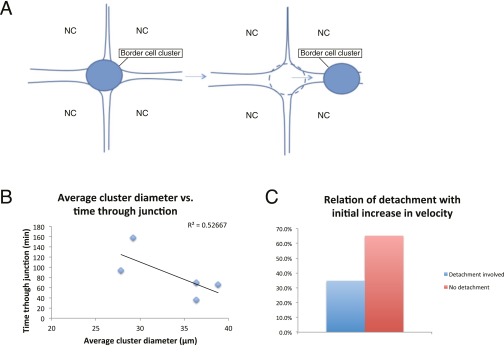
Fig. S5.
Nurse cell influence on border cell migration. (A) Illustration of border cell cluster untrapping from a nurse cell–nurse cell junction. NC, nurse cell. (B) Time spent untrapping from a junction in relation to cluster size. Linear regression was done and linear plot was shown in the graph. (C) Percentage of border cell migration movies that show an initial increase in speed that have detachment (blue bar) and no detachment (red bar) involved.

