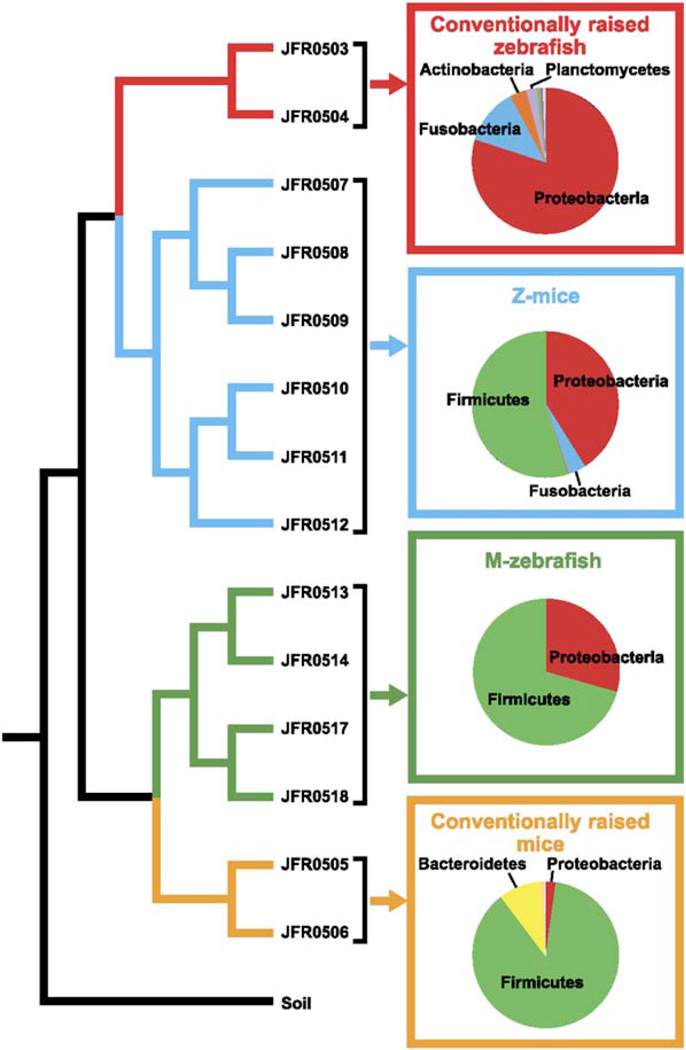
Figure 2. Comparison of Input and Output Communities following Reciprocal Transplantation of Gut Microbiotas in Gnotobiotic Zebrafish and Mice.
Tree based on pairwise differences between the following bacterial communities (weighted UniFrac metric, based on a 6379 sequence tree; Lozupone and Knight, 2005): (1) CONV-R zebrafish digestive tract microbiota (conventionally raised zebrafish, red); (2) CONV-R mouse cecal microbiota (conventionally raised mice, yellow); (3) output community from the cecal contents of ex-GF mice that had been colonized with a normal zebrafish microbiota (Z-mice, blue); (4) output community from the digestive tracts from ex-GF zebrafish that had been colonized with a normal mouse microbiota (M-zebrafish, green); and (5) a control soil community that served as an outgroup (Soil; Axelrood et al., 2002). The distance p value for this entire UniFrac tree (UniFrac P, the probability that there are more unique branches than expected by chance, using 1000 iterations) was found to be <0.001, assigning high confidence to the overall structure of the UniFrac tree. 16S rRNA library names are shown next to their respective branch (see Table S1 for additional details about these libraries). The relative abundance of different bacterial divisions within these different communities (replicate libraries pooled) is shown in pie charts with dominant divisions highlighted.

