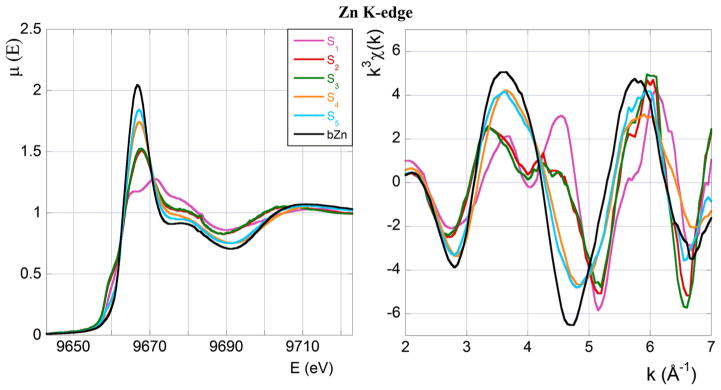
Fig. 1.
XAS spectra at the Zn K-edge. Left panel: XANES absorption coefficient, μ(E), as a function of the photon energy, E in eV. Right panel: normalised, weighted EXAFS signal, k3 χ(k), as a function of the wave vector, k in Å−1. Colour code and sample composition are as given in Table 1

