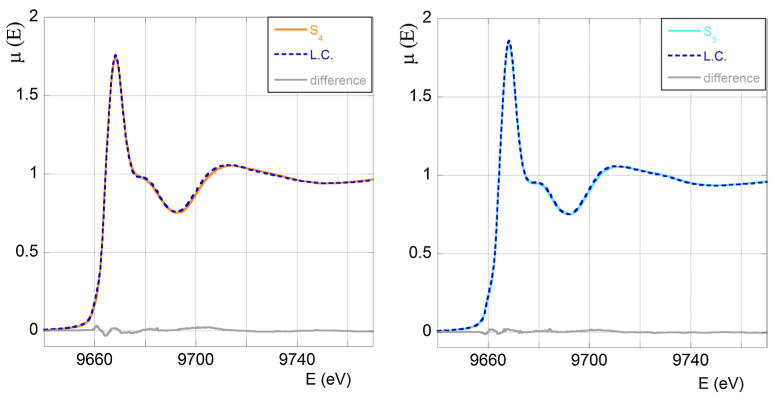
Fig. 3.
In the left panel we show the S4 experimental XANES spectrum (orange full line) compared with the optimum linear combination (LC, blue broken line) of the S1 and bZn spectra. In the right panel we show the S5 experimental XANES spectrum (light blue full line) compared with the optimum linear combination (LC, blue broken line) of the S3 and bZn spectra obtained. In grey we draw the difference between the experimental signal and the theoretical fit

