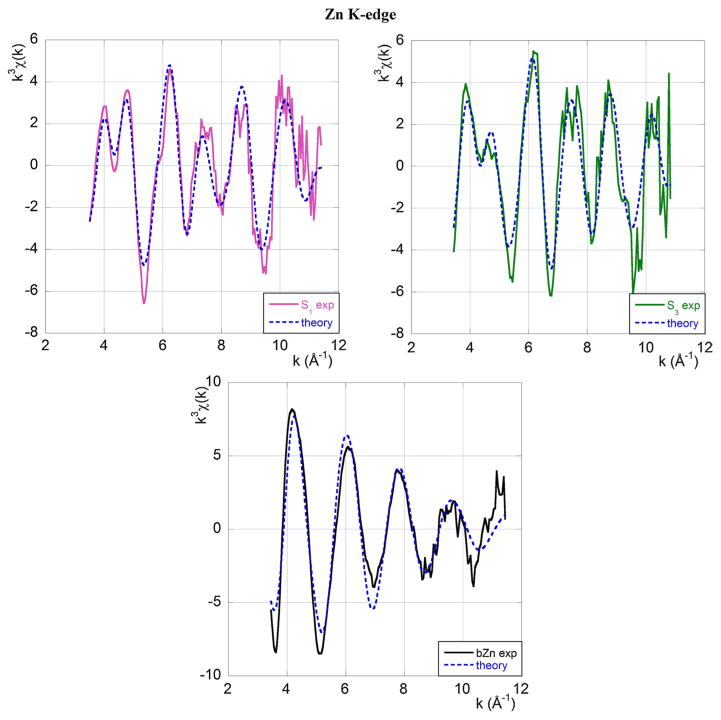
Fig. 4.
Experimental EXAFS data at the Zn K-edge (full line) and the best-fit theoretical model (broken blue line). The top left panel refers to sample S1, the top right panel to sample S3 and the central panel to Zn in buffer. Colour code and sample composition are as given in Table 1

