
Fig. 3.
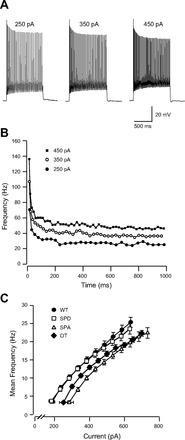
AP discharge in HMs during square step current injection. A: representative traces from a wt HM in response to increasing levels of current injection (1-s duration). B: plot of instantaneous frequency vs. latency from current step onset for the 3 different current step responses shown in A. Note, the rapid adaptation that occurs during the first 200 ms of each current step and the relatively constant discharge thereafter. C: comparison of mean firing frequency vs. current step amplitude for the 4 genotypes. Data have been normalized to rheobase current for each genotype. Note the gains are similar in all 4 genotypes.