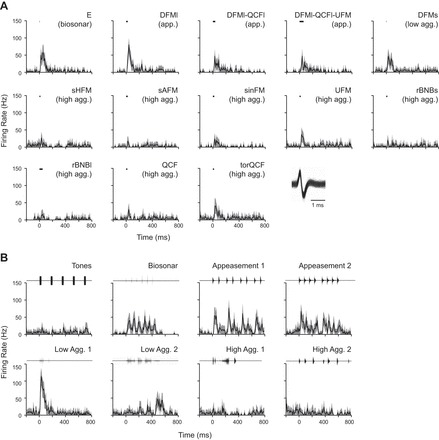
Fig. 7.

A high-background neuron (4.5 spikes/s) responded to all of the tested stimuli but showed clear differences in discharge pattern. For syllables (A) and sequences (B), mean firing rate (black line) and 95% confidence intervals (light gray outline) are shown, binned at 10 ms. Black bar represents stimulus timing and duration for syllables, whereas the waveforms of vocal sequences are plotted above. Note that responses to individual syllables do not always predict responses to sequences. Inset: overlaid spike waveforms demonstrate a well-isolated neuron.
