
Fig. 2.
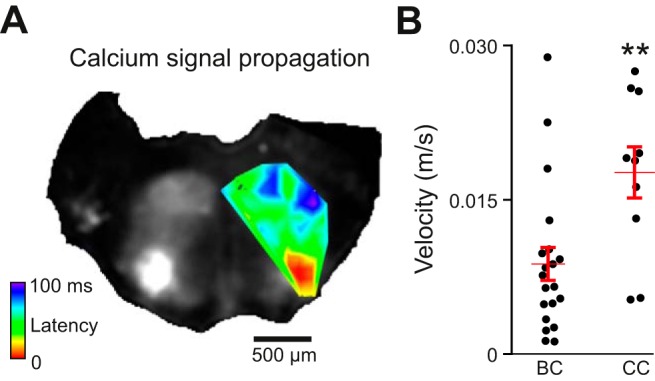
Propagation of calcium activity in brain stem slice cultures and brain stem-cerebellar cocultures. A: time series Z projection of maximum fluorescent calcium activity in a brain stem-cerebellar coculture. The heat map overlay shows threshold signal increases from low (red) to high latencies (blue) during a single rhythmic burst acquired at 129 frames/s. B: average velocity of signal propagation in BC vs. CC preparations. Error bars indicate means ± SE. **P < 0.001 (Student's t-test).