
Fig. 3.
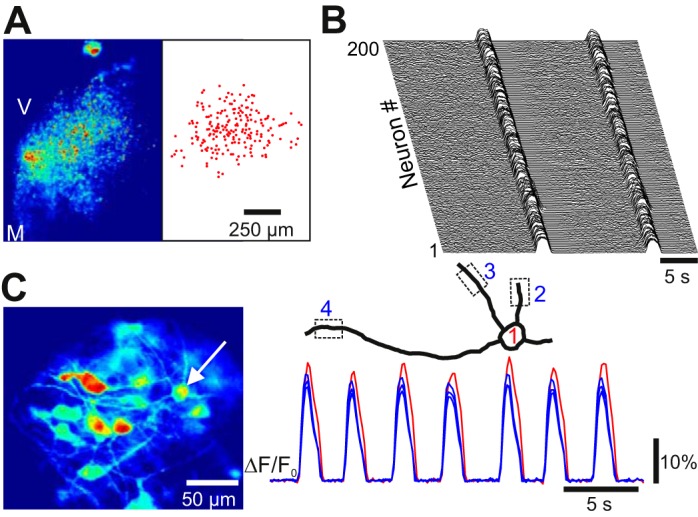
Low- and high-magnification views of oscillatory activity. A, left: oscillatory calcium activity in the ventral oscillatory group at low magnification using ×10 objective (Z projection of standard deviation from 200-frame image stack at 10 Hz; V, ventral; M, medial). Right, position of 200 oscillating cell body ROIs from the image at left. B: waterfall diagram of ΔF/F0 traces from the 200 ROIs shown in A. Note the tight synchronization during 2 cycles. C, left: cycle-triggered average of oscillatory calcium activity at high magnification using a ×63 objective. Note the visualization of somas and dendritic profiles. Right, reconstruction of the soma-dendritic territory from 1 neuron and the associated ΔF/F0 traces from 3 dendritic and 1 somatic ROI (indicated by dotted squares).