
Fig. 6.
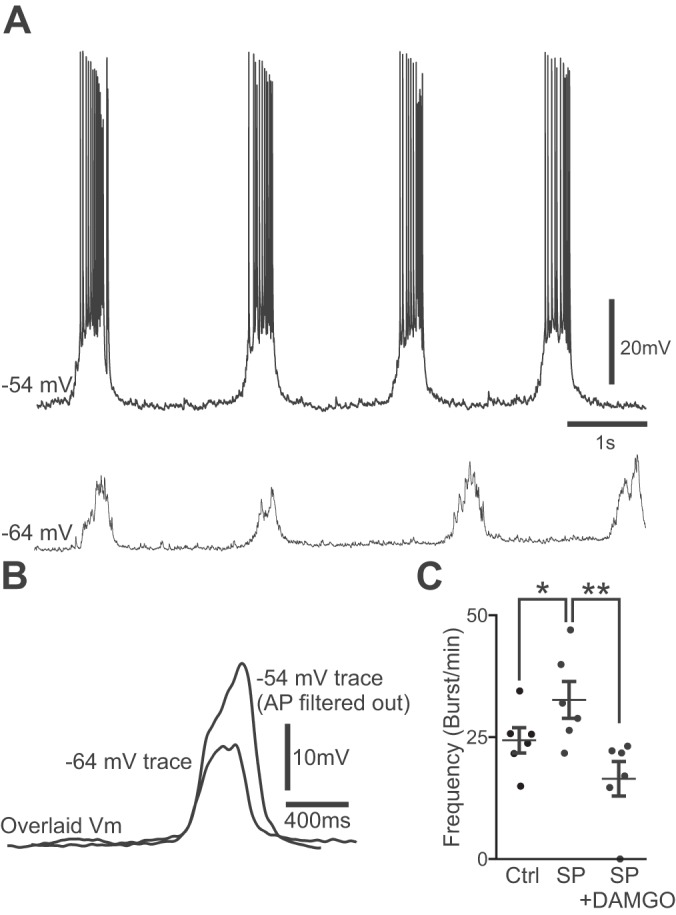
Whole cell patch-clamp recordings from a rhythmically active neuron in the ventral oscillatory group of a brain stem-cerebellar coculture after 7 days in vitro. A, top trace: normal bursting activity at resting membrane potential (Vm) with zero current bias applied. Bottom trace, rhythmic drive potential at a hyperpolarized potential after negative bias (−0.1 nA) was applied. B: overlaid cycle-triggered and action potential-filtered average traces of the burst events occurring in A. Note that the underlying burst envelope is larger in amplitude at resting Vm levels. C: modulation of burst frequency by 500 nM substance P (SP) and 500 nM SP + 1 μM [d-Ala2, N-Me-Phe4, Gly5-ol]-enkephalin acetate salt (DAMGO). Error bars indicate means ± SE (n = 6). *P < 0.05, control (Ctrl) vs. SP. **P < 0.001, SP vs. SP + DAMGO (paired-sample t-tests).