
Fig. (3).
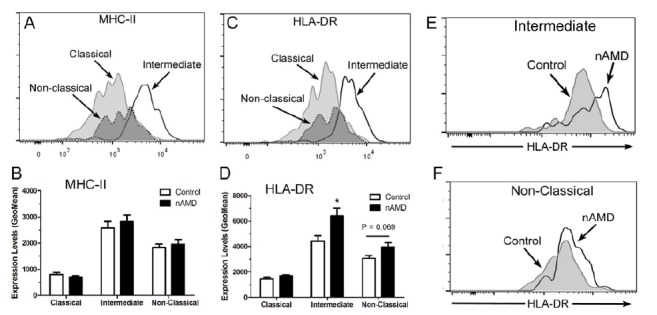
MHC-II and HLA-DR expression in different subsets of monocyte in nAMD patients. (A, C) Representative histogram from healthy control donor showing MHC-II (A) and HLA-DR (C) expression in different subsets of monocytes. (B, D), the average expression level of MHC-II (B) and HLA-DR (D) in monocytes from nAMD patients and controls. *, P < 0.05 compared to control of the same monocyte subset. Mean ± SEM, n = 22 in control; n = 27 in nAMD. (E, F), representative histogram showing HLA-DR expression in intermediate monocytes (E), and non-classical monocytes (F) in nAMD and controls.