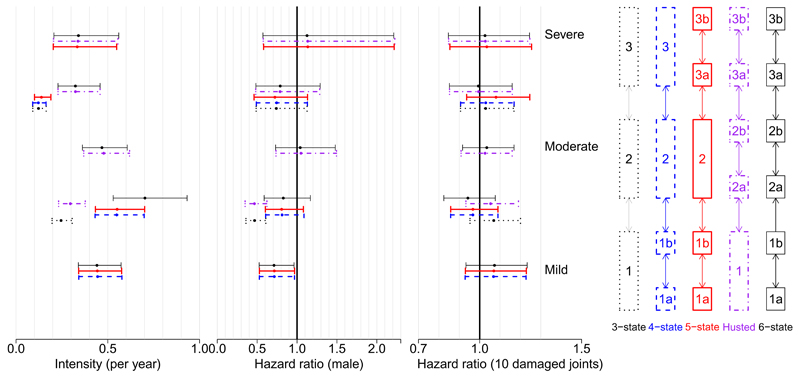
Figure 3.
Progression to the next state of severity. Estimates and 95% confidence intervals for baseline rates (female, 0 damaged joints) per day and hazard ratios under five different state structures. Each interval is aligned horizontally with the corresponding transition in the model structure on the right with the same colour and line type

