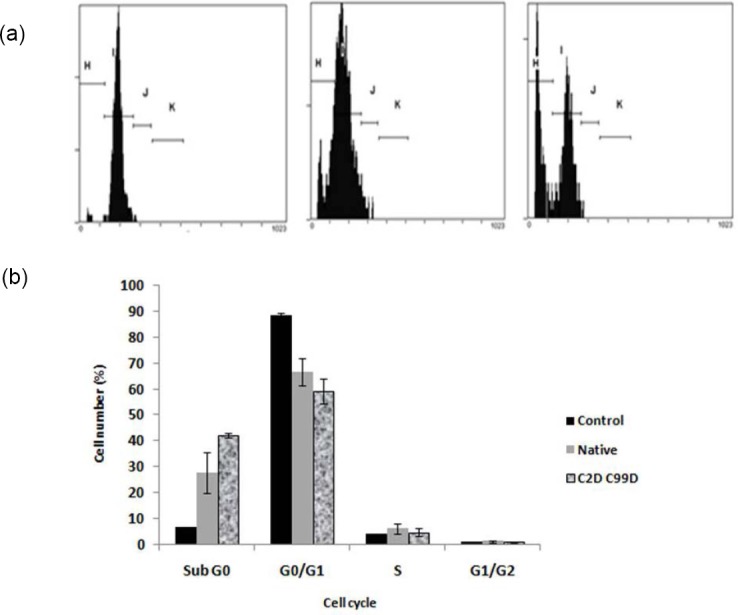
Fig. 6.

The influence of treatment on the HepG2 cell cycle. A. Flow cytometric analysis ilustrating celullar DNA content. DNA histogram number 1= control, 2= native rIFNα2b, 3= mutein rIFNα2b (C2D C99D); B. The percentage of cell number in different phase of cycles. Protein concentration was 5 ug/mL and treatment time was 72 h. The mutein rhIFNα2b tends to show better proapoptotic activity.
