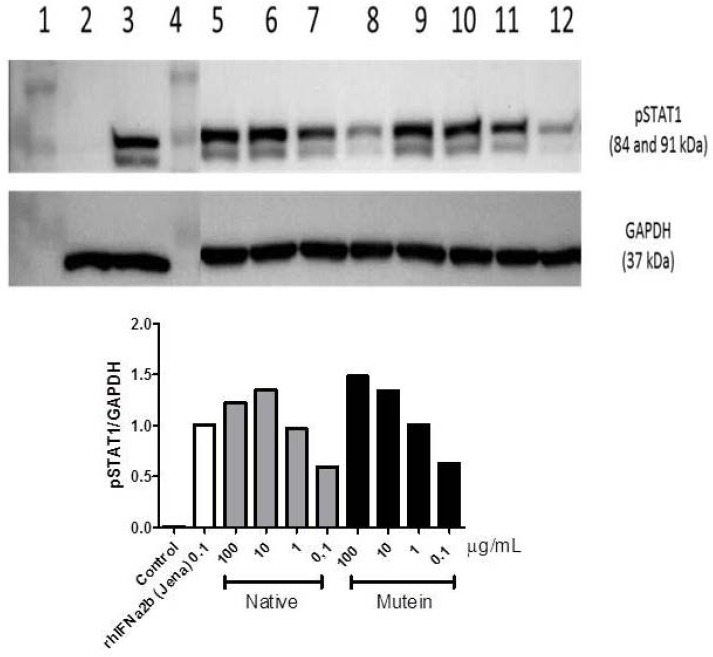
Fig. 8.

pSTAT1 expression after cells were treated with interferon alpha 2b. (A) Western Blot analysis of pSTAT1: 1= protein marker, 2 = untreated cells, 3 = treated with commercial IFN-α2b, 5-8 = treated with native IFN-α2b (100 µg/mL, 10 µg/mL, 1 µg/mL, 0.1 µg/mL), 9-12 = treated with mutein rIFN-α2b (100 µg/mL, 10 µg/mL, 1 µg/mL, 0.1 µg/mL). (B) Semiquantitative analysis of pSTAT1 expression.
