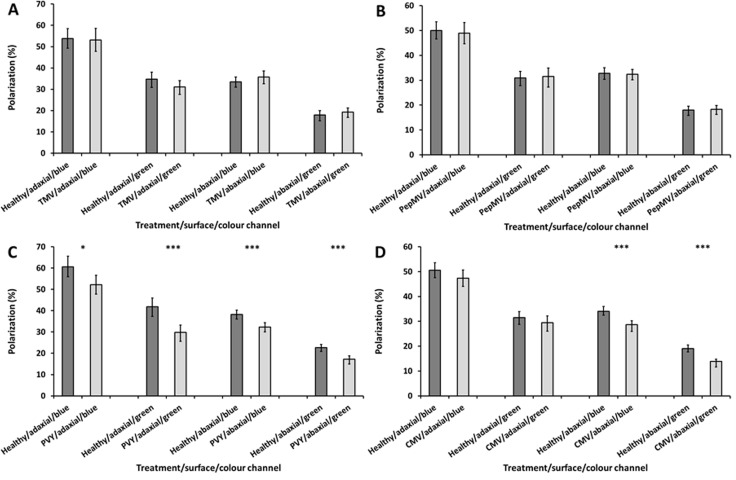
Fig 2.
Average percentage polarization of light reflected from the adaxial and abaxial surfaces of TMV (A), PepMV (B), PVY (C) and CMV (D) infected N. tabacum leaves in comparison to healthy control leaves, in blue and green channel light. Error bars denote 95% confidence intervals; asterisks indicate statistically significant differences between healthy and infected leaves (*<0.05; ***<0.001). A total of 27–33 leaves (with each leaf removed from a separate plant) were analysed within each of the four viral treatments, and were compared to similar numbers of healthy leaves. All imaging experiments were performed at 21 DPI.

