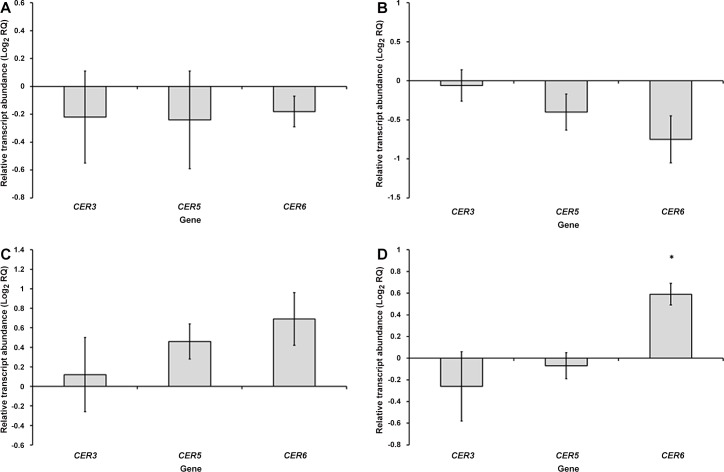
Fig 3.
Transcript levels of CER3, CER5 and CER6 in N. tabacum leaves systemically infected with TMV (A), PepMV (B), PVY (C) or CMV (D) at 7 DPI, expressed relative to transcript levels in healthy leaves (as Log2 RQ). Error bars for each gene denote the standard error of the mean relative change in expression between healthy and infected samples (across the three biological replicates), asterisks indicate statistically significant differences between healthy and infected leaves (*<0.05).

