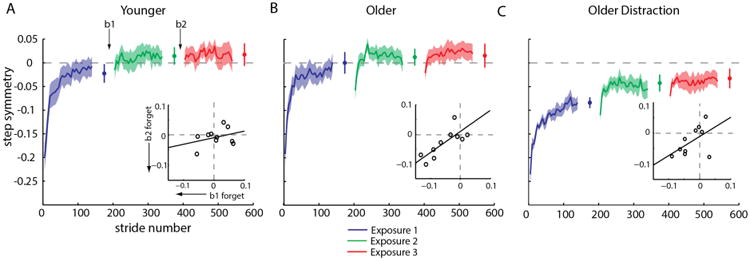
Figure 2.

Comparison of step symmetry adaptation across groups. Group adaptation curves (smoothed by 5 strides) and shaded standard error regions are shown. Plateau values for each exposure are plotted. Inset shows the correlation between forgetting during break 1 and 2 for each group. A. ‘Younger’ subjects showed no forgetting during ‘rest’ breaks. Notice that the first point of the subsequent exposure is not different from the plateau preceding it. B. ‘Older’ subjects demonstrated time-related forgetting. Upon re-exposure to the split-belts, the ‘Older’ group showed fast re-adaptation transients. There is a significant positive correlation between the forgetting during break 1 and 2 for ‘Older’ subjects. C. The ‘Older Distraction’ group shows a slower adaptation rate in exposure 1, but forgetting still occurred during the ‘rest’ breaks. They also never achieve complete symmetry during adaptation.
