
Figure 3.
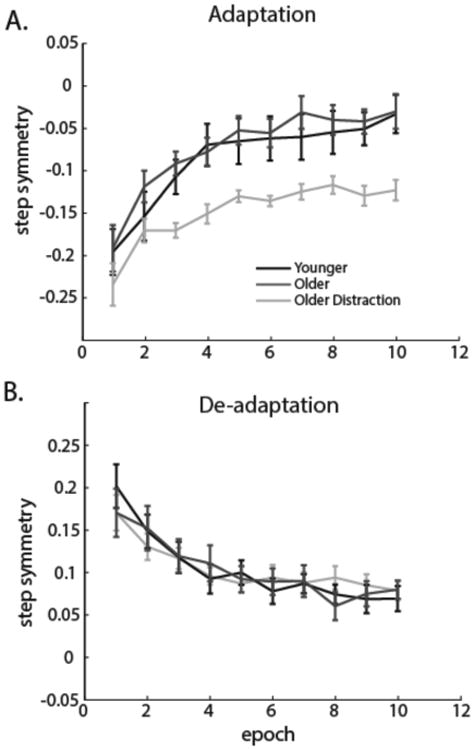
Adaptation and de-adaptation rates are shown. Epochs of five strides are shown for the first 50 strides in adaptation and de-adaptation. No age-related differences were found for the rate of adaptation (A) or de-adaptation (B). There was significant slowing in the adaptation rate for the ‘Older Distraction’ group compared to the ‘Older’ group (A), but not in the de-adaptation rate (B).