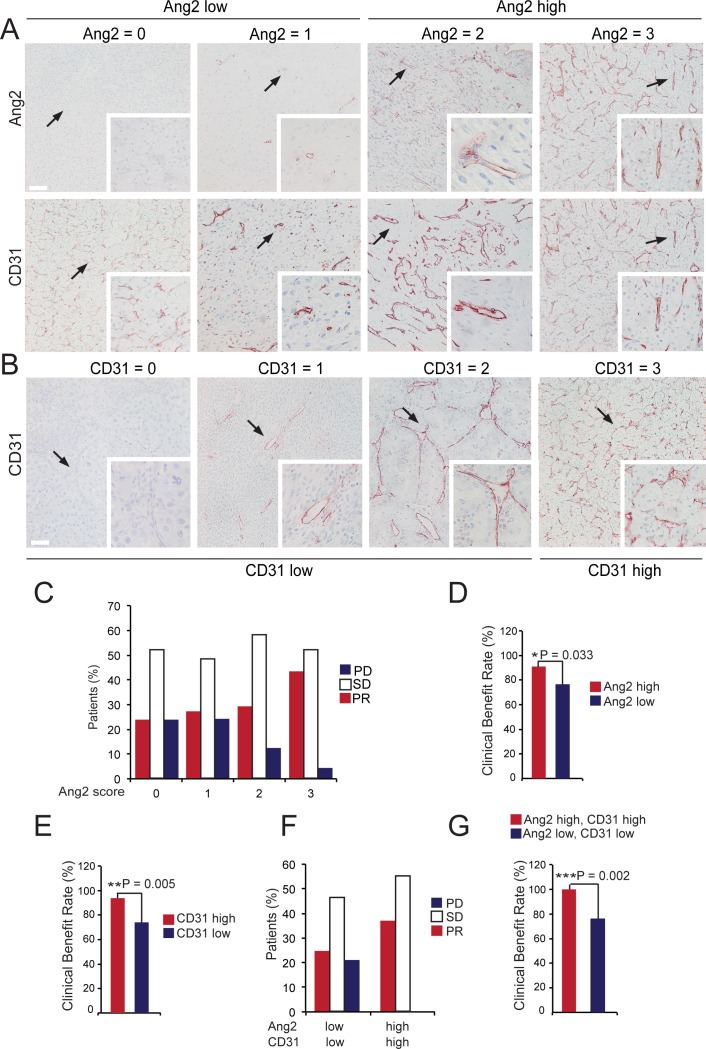
Fig 2. Association of Ang2 and CD31 expression with sunitinib response in mRCC.
Immunohistochemical staining of mRCC primary tumour tissue using antibodies to Ang2 (A) and CD31 (A, B). (A) Representative images of mRCC tumours with negative (Ang2 = 0), weak (Ang2 = 1), moderate (Ang2 = 2) and high (Ang2 = 3) Ang2 expression scores, and their distribution in the Ang2 low (scores 0 and 1) and Ang2 high categories (scores 2 and 3) (top panel in A). Adjacent sections were stained for CD31 (bottom panel in A, scores not indicated). (B) Representative images of mRCC tumours with negative, weak, moderate (CD31 = 0, CD31 = 1, CD31 = 2) and high (CD31 = 3) CD31 expression scores, and their distribution in the CD31 low (scores 0–2) and CD31 high categories (score 3). (C) The percentage of patients with PR, SD and PD responses according to Ang2 expression scores 0–3, from negative (0) to high (3) expression. (D-E) High Ang2 (D) and high CD31 (E) protein expression in the mRCC tumour vasculature was associated with increased clinical benefit rate (CBR, PR/SD sunitinib responses) using Fisher’s exact test. (F) The percentage of patients with PR, SD and PD responses according to combined Ang2 and CD31 expression. (G) The combination of both high Ang2 and high CD31 protein expression was associated with increased CBR responses using Fisher’s exact test. PR, partial response; SD, stabilized disease; PD, progressive disease. Arrows indicate the magnified areas. Magnifications x100 and x400. Scale bar 80 μm.

