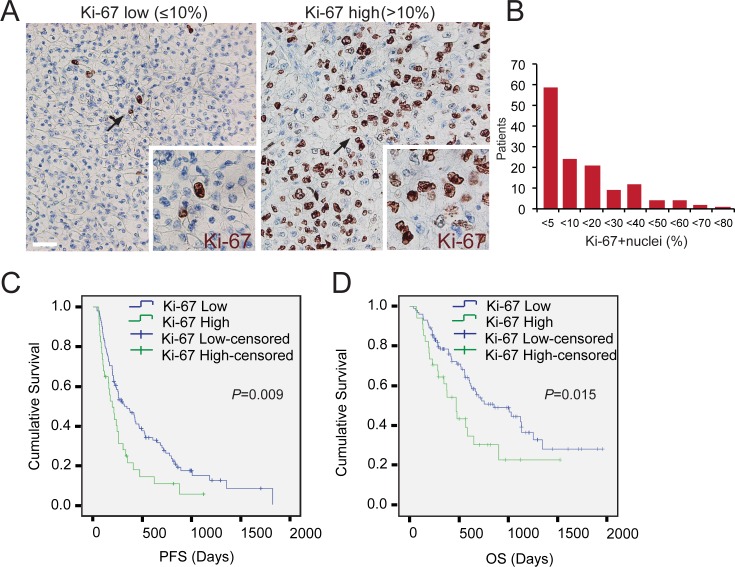
Fig 3. Correlation of Ki-67 expression with progression-free and overall survival in mRCC in response to first-line sunitinib.
(A) Representative images of tumours with low Ki-67 expression (Ki-67+ nuclei % ≤10%), and high Ki-67 expression (Ki-67+ nuclei % >10%). (B) The distribution of patients according to Ki-67 expression, expressed as the % of Ki-67+nuclei. (C-D) Kaplan-Meier survival curves (Log rank) of progression-free (C) and cancer specific survival (D) in patients with low Ki-67 (blue) and high (green) Ki-67 expression scores. Arrows indicate the magnified areas. Magnifications x200 and x400. Scale bar 40 μm.

