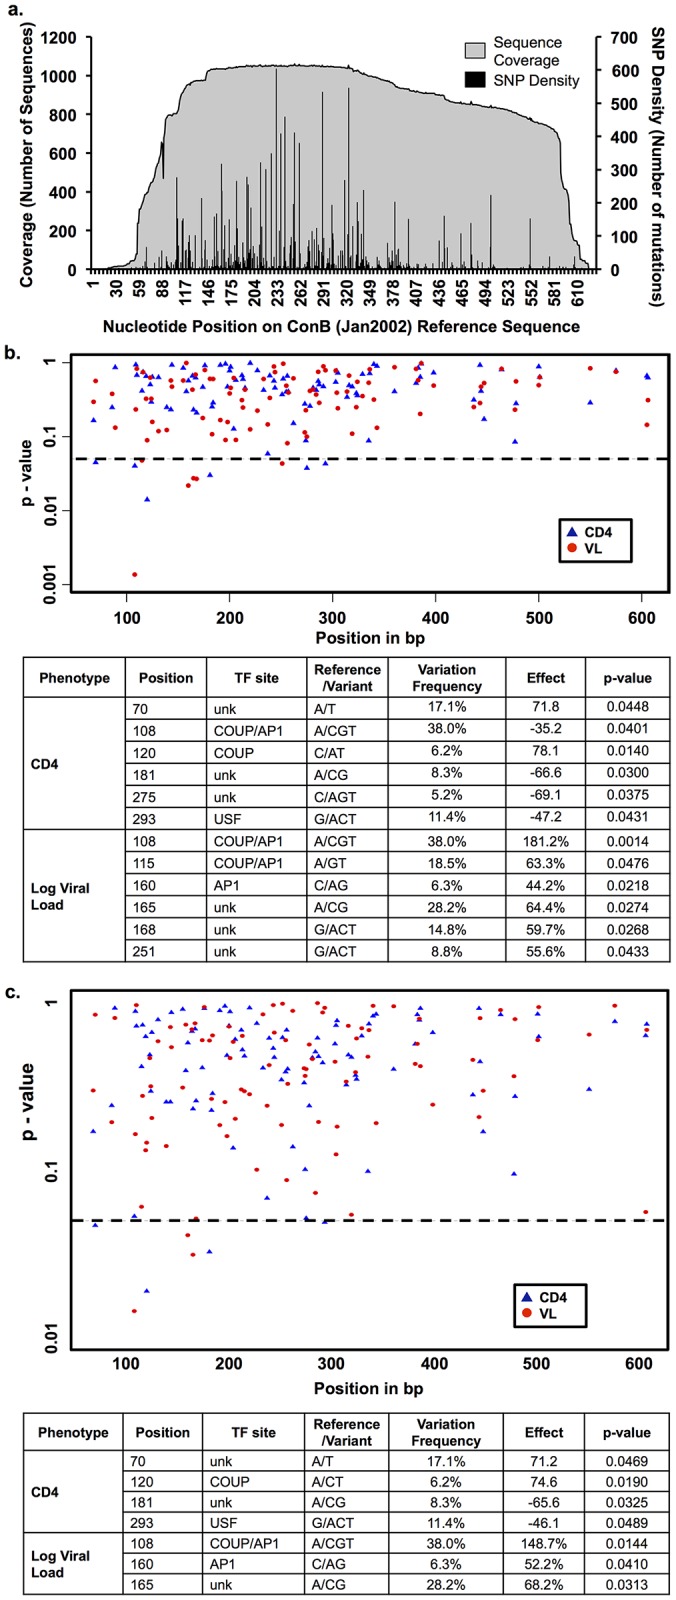
Fig 3. Viral single nucleotide polymorphism (vSNP) density and identification of vSNPs associated with CD4+ T-cell count and viral load (VL) within the HIV-1 LTR in the Drexel Medicine CARES Cohort.

(a) Coverage and vSNP frequency across the HIV-1 LTR were determined for 1,113 LTR polymerase chain reaction sequences obtained to date by comparison to the ConB (Jan2002) reference sequence. Positional hotspots were identified at positions 108, 139, 164, 165, 183, 196, 198, 213, 220, 227, 233, 239, 244, 256, 262, 291, 319, 324, 335, 343, 381, 501, and 606. A position was considered a hotspot if >25% of the sequences contain a base other than the reference sequence. (b) Scatter plot and table of P values from individual SNP association tests for CD4+ T-cell count and log VL were determined using linear mixed models of the cross-sectional data adjusted for sex, age, race, and days since baseline visit. For each SNP, the position in the HIV-1 LTR was provided along with the ConB sequence nucleotide, the associated variation, the putative transcription factor binding site (TFBS), and the frequency at which this variation occurred within the cohort. The associated effect is provided where a minus sign is a decrease and the effect is measured away from the average. (c) Scatter plot and table of P values from individual SNP association tests for CD4+ T-cell count and log VL determined as in part “a,” but also adjusted for HAART (highly active antiretroviral therapy) status. Unk = unknown.
