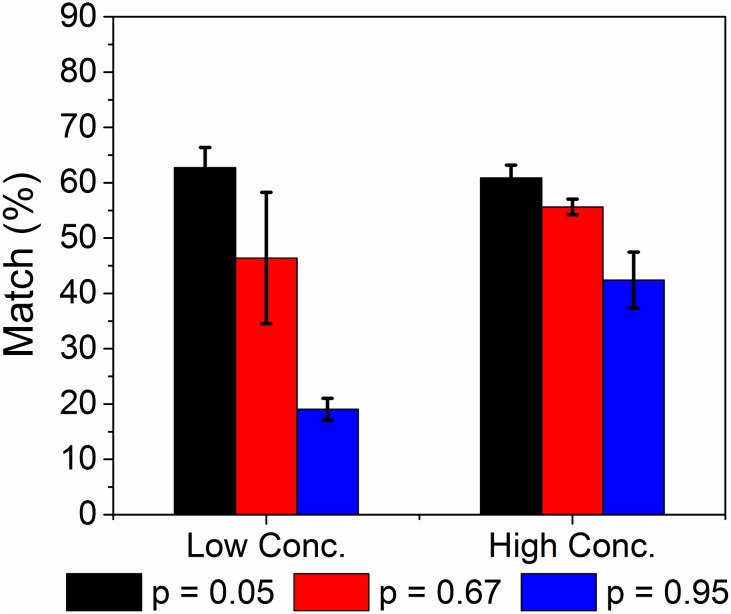
Fig 6. Effect of cutoff p-value on omFBA prediction using “small pool” of genes.
Three cutoff p-values, i.e., 0.05, 0.67, and 0.95, were used to filter the transcriptomics data. For each cutoff p-value, we re-ran the omFBA algorithm for 40 times and calculated the percentage of matches between the predicted and the observed ethanol yields in the validation datasets.

