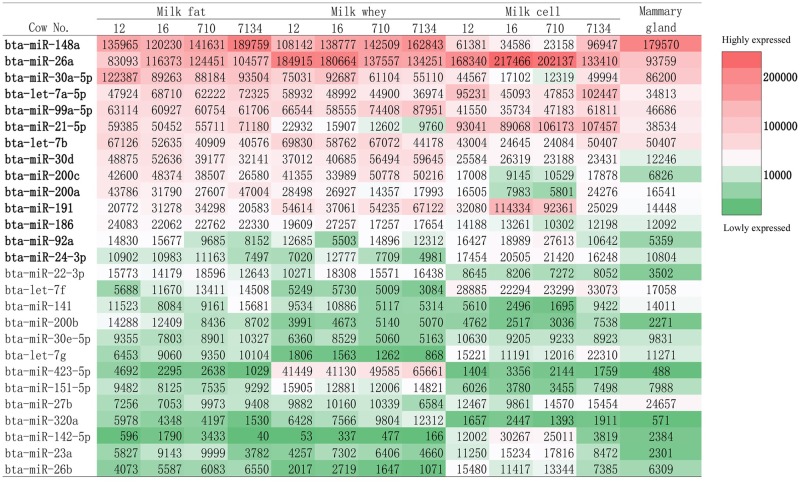
Fig 7. Most highly expressed miRNAs in cow milk fat, whey, cells and mammary gland tissues expressed in count per million (CPM).
Red color represents the most highly expressed miRNAs while green color represents relatively lowly expressed miRNAs with lighter color intensities as intermediate highly expressed miRNAs. Underlined CPM numbers indicate that the corresponding miRNAs are among the top 20 expressed miRNAs in the corresponding milk fraction or mammary gland tissue. Four miRNAs that were only among the top 20 expressed miRNAs in mammary gland tissue are not shown.

