Fig. 4.

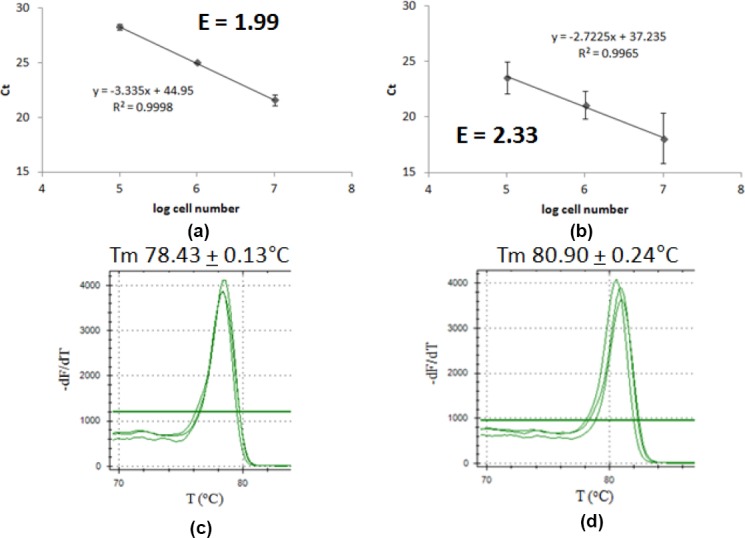
qPCR result for pBR322 P/C ratio determination. Graph of Ct correlation to cell number of (a) chromosome as target, (b) pBR322 plasmid as target; melting curve analysis of (c) chromosome as target, (d) pBR322 plasmid as target.

qPCR result for pBR322 P/C ratio determination. Graph of Ct correlation to cell number of (a) chromosome as target, (b) pBR322 plasmid as target; melting curve analysis of (c) chromosome as target, (d) pBR322 plasmid as target.