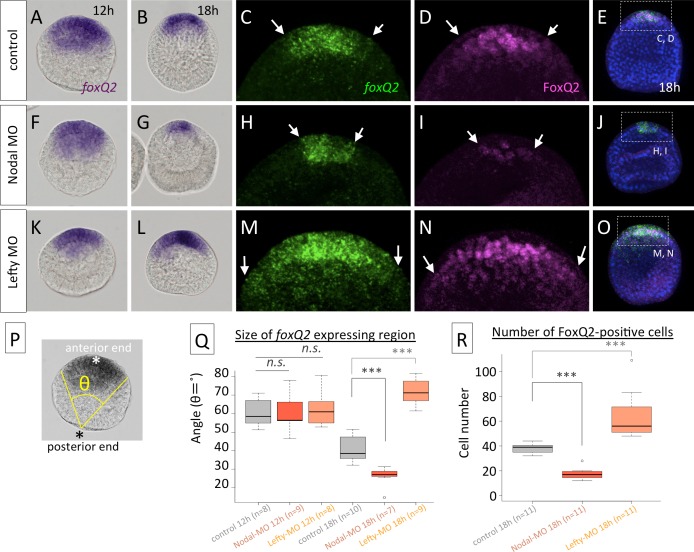
Fig 3. Nodal maintains foxQ2 expression.
foxQ2 mRNA and FoxQ2 protein patterns in control embryos (A-E), Nodal morphants (F-J) and Lefty morphants (K-O). Arrows in (C, H, M) and (D, I, N) indicate the edge of the foxQ2-mRNA and FoxQ2-protein region, respectively. (P) The image shows how the foxQ2-expressing area was measured with the angle (θ) from the posterior end. (Q) Quantification of the size of the foxQ2 region in the control (A, B), Nodal morphants (F, G) and Lefty morophants (K, L). The foxQ2 region in Nodal morphants and Lefty morphants is significantly narrower and wider, respectively, than that in the control at 18 h, whereas they are all similar at 12 h. (R) Quantification of the number of FoxQ2-protein positive cells in the control (E), Nodal morphants (J) and Lefty morphants (O). n.s. not significant, ***P<0.001, Student’s t-test. foxQ2 expression pattern is almost asymmetrical during all stages shown in this figure.

