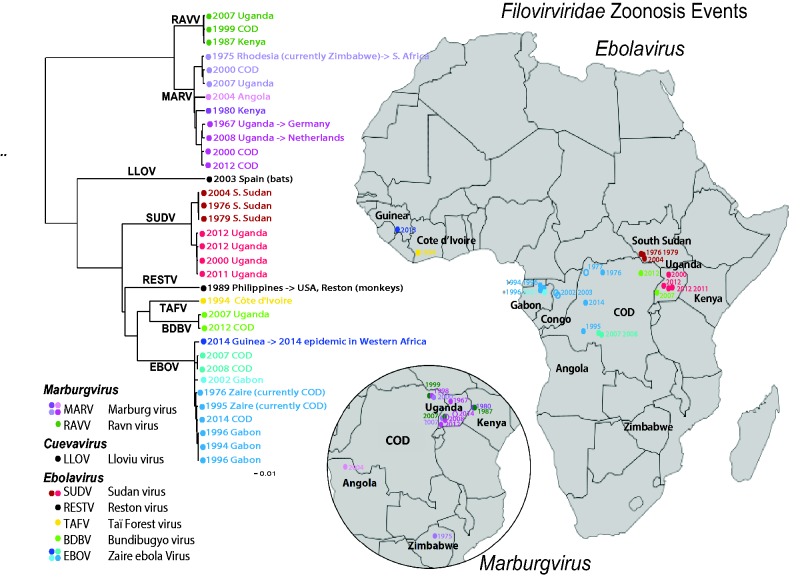
Figure 1.
Human outbreak map and phylogeny of filoviruses. Using just the concatenated coding regions of the 34 one-per-outbreak sequences from the database (excluding the non-coding regions as they vary in length, and are very difficult to reliably align across species), we reconstructed the phylogeny of all filovirus outbreak sequences (see also Supplementary Figure S1), using the PHYML web interface provided through the HFV database (37) (http://hfvdev.lanl.gov:9100/content/sequence/PHYML/interface.html). Here, the year and the country name for each sequence are given to highlight the timing of a source of the sampled outbreak. Details concerning the sequences included in this tree and phylogenetic methods are shown in Supplementary Figure S1. If a virus was contracted by an individual while visiting a country, but discovered upon return to their own county, it is labeled with an arrow. For example a South African was infected with Marburg virus while visiting Rhodesia (now Zimbabwe) in 1975, and so the taxon representing this infection is labeled ‘ZW -> ZA 1975’ where ZW is the ISO 2 letter code for Zimbabwe, ZA is the code for South Africa, and 1975 is the year of sampling. It corresponds to the point in Zimbabwe on the Marburg inset map, labeled 1975. Of note, if the year of sampling of the sequence in the tree is later than a corresponding year in the map, it is because the disease outbreak spanned a year. For example, the 2013–15 EVD outbreak in Western Africa began with an index case infected in December 2013, so it is labeled 2013 on the map; as the first samples that were sequenced were obtained in March 2014, 2014 is indicated in the tree. The geographic source of each sequence and the time of sampling were used to associate the sequences with the disease outbreak lists (CDC links). Several of the human disease outbreaks listed by the CDC did not have a corresponding sequence, and those are noted with a year in the map, but are represented as open oval; filled ovals represent disease outbreaks with a corresponding sequence. In some cases the precise location of an outbreak is not known; for instance, the location within Uganda where the African Green Monkeys that first carried MARV to Germany is just represented by a point in Uganda; some outbreaks were only noted to be within a particular province. Viruses from different species are assigned different colors, and clades representing phylogenetically closely related sequences are indicated by similar colors.

