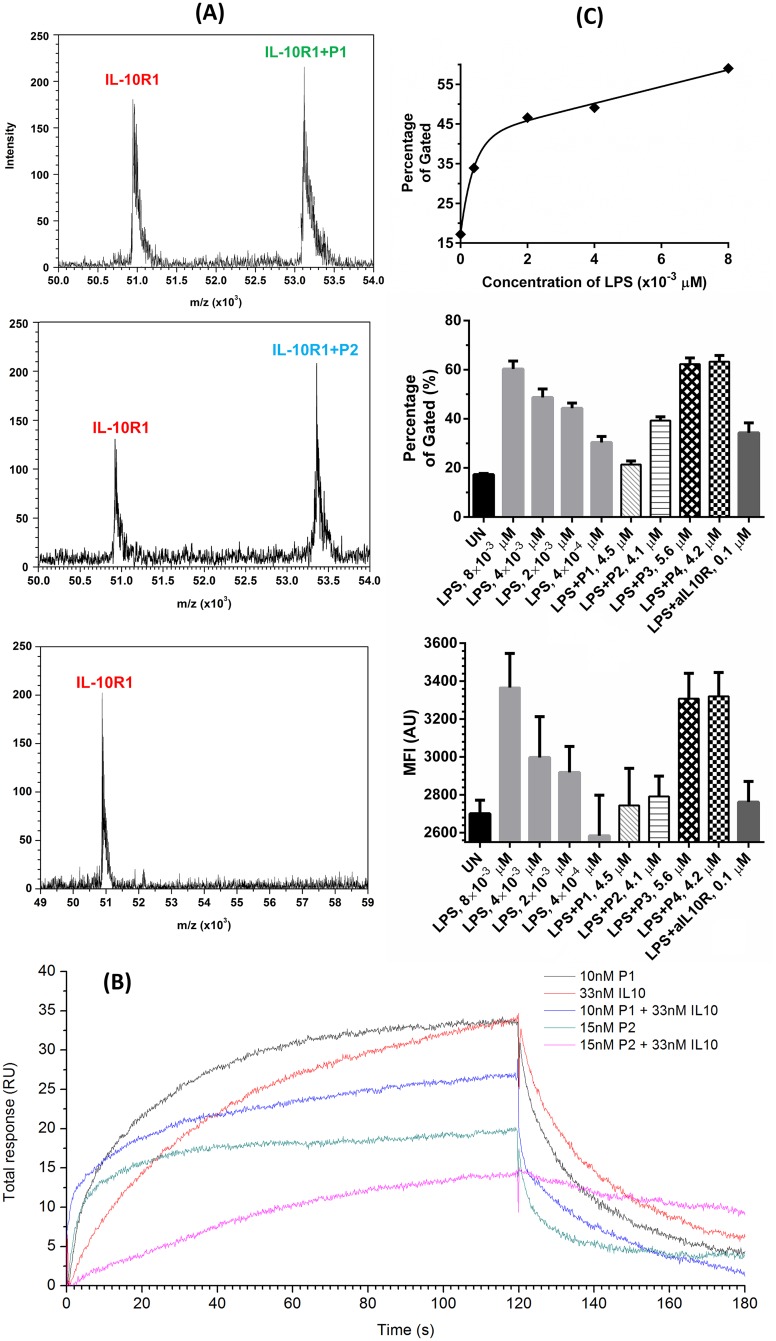
Fig 2.
(A) MALDI mass spectra of IL-10R1 when mixed with P1, P2 and P3 as shown. Only P1 and P2 displayed a peak corresponding to the mass of the complex structure. (B) An overlay of sensorgrams of the SPR competitive binding assay of peptides P1 and P2. Compared with sensorgrams with only IL-10 or the corresponding peptide at the same concentration, a loss in total response was observed when P1 or P2 were co-injected with IL-10. (C) IL-10R expression levels in 3×10⁵ U937 with anti-human CD210 using flow cytometry: stimulated with different amount of LPS overnight; unstimulated and stimulated with LPS (4×10⁻³ μM), LPS (4×10⁻³ μM) + P1 (4.5 μM), P2 (4.1 μM), P3 (5.6 μM) or P4 (4.2 μM), and LPS (4×10⁻³ μM) + aIL10R1 overnight, respectively; the mean fluorescence intensity (MFI) result of IL10-R expression.

