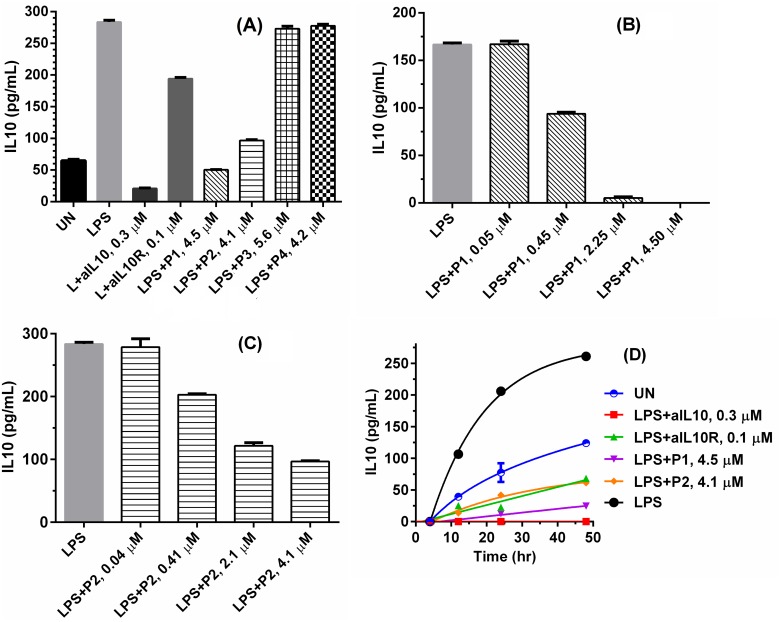
Fig 4. P1 and P2 reduce IL-10 secretion in U937 cells stimulated by LPS.
Supernatants were measured in the presence of IL-10 by ELISA. The concentration of LPS is 4×10⁻³ μM: (A) 3×10⁵ human U937 were either left unstimulated (UN) or stimulated with LPS, LPS+0.3 μM of anti-IL10 (aIL10), LPS+0.1 μM of aIL10R, LPS+P1, 2, 3 and 4 at 4.5, 4.1, 5.6, 4.2 μM overnight, respectively. (B) 1×10⁵ of U937 cells were treated with LPS and different concentration of P1 overnight. (C) 1×10⁵ of U937 cells were treated with LPS and different concentration of P2 overnight. (D) 1×10⁵ of U937 cells were unstimulated or stimulated with LPS, LPS+aIL10, LPS+aIL10R, LPS+P1 and LPS+P2 for 4, 12, 24 and 48 hours.

