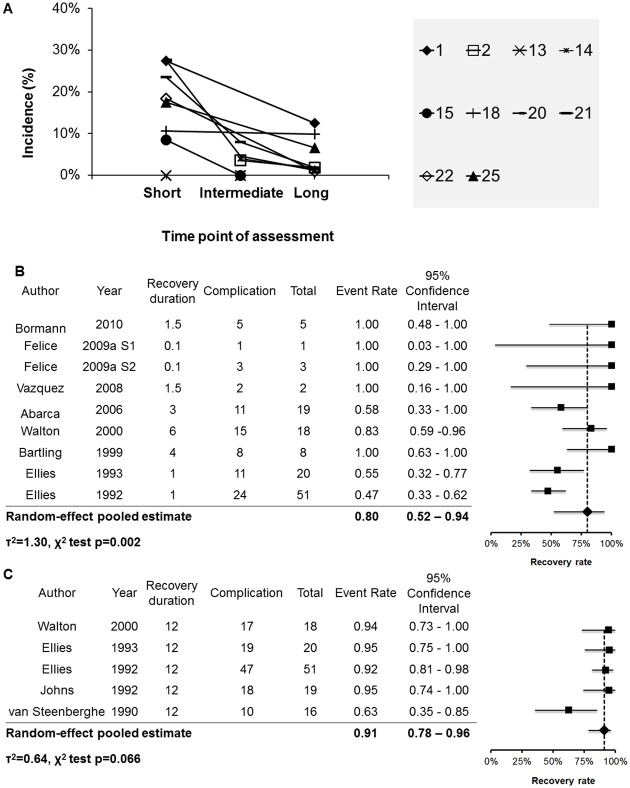
Fig 3. Recovery rate of altered sensation.
(A) The incidence of altered sensation through the duration of follow up. All the studies have assessed the occurrence of altered sensation for at least two different time points, according to the outcomes presented in Table 4. Study IDs of the included studies are shown in the legend. (B) The forest plot for the recovery rate, when recovery duration ≦ 6 months. (C) The forest plot for the recovery rate, when recovery duration = 1 year.

