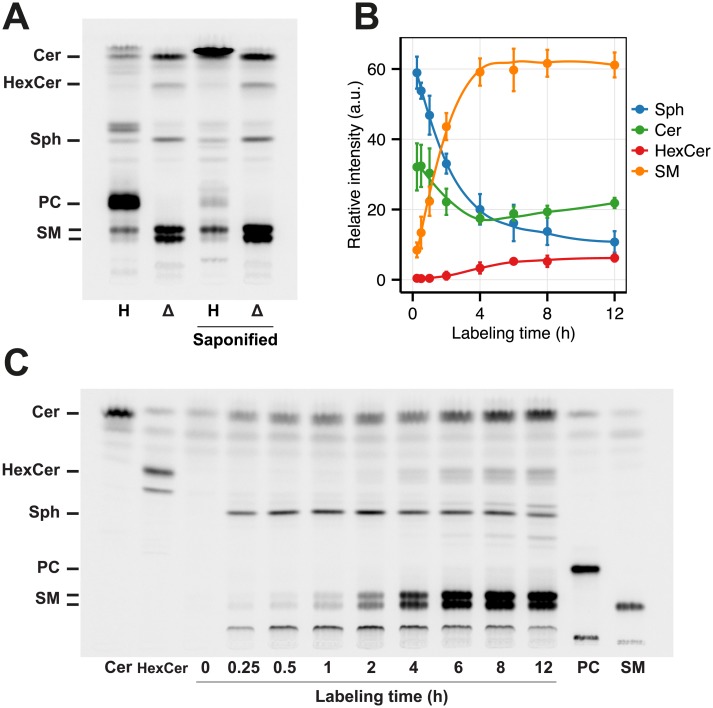
Fig 2. Characterization of the HeLa ΔSGPL1 cell lines.
(A) HeLa wildtype (H, Lane 1) and HeLa ΔSGPL1 (Δ,Lane 2) cells were labeled with 6 μM pacSph for 6 h. Lipids were extracted and subjected to click reaction with fluorogenic fluorescein, separated by TLC and excited with blue light. Lipids were identified based on comparison to the respective lipid standards (see Fig 2C). Both samples were also subjected to alkaline hydrolysis (Lane 3 and 4). (B) Quantification of the fluorescence intensities of Fig 2C. Mean ± SD (n = 3) are shown (S2 Table). Each timepoint is standardized to 100% of lipids quantified. Data are fitted by Local Polynomial Regression Fitting (LOESS, degree = 2) as curves. (C) HeLa ΔSGPL1 cells were labeled for the time points indicated and treated as in (A). As reference, 50 pmol of each clickable Cer, HexCer, PC and SM (S3 Fig) was loaded as standard.

