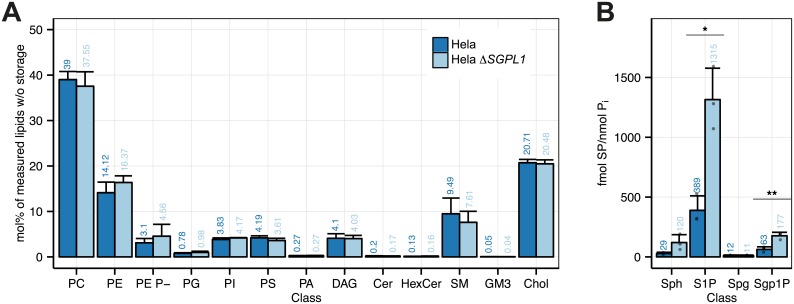
Fig 4. Lipidomics analysis of the HeLa and HeLa ΔSGPL1 cell lines.
(A) Class profile, standardized to all lipids measured without storage lipids (TAG and CE). GP O- lipids are contained in the sum of each class (e.g. PE O- in PE) and may show overlap with diacyl species containing odd-numbered fatty acids. PE P-lipids are displayed as a separate class. (B) Sphingoid bases and sphingoid base 1-phosphates standardized to total phosphate (fmol/nmol Pi). Data are shown in S3 Table. A Welch Two Sample t-test was used to estimate the P values: *, p < 0.05; **, p < 0.01; ***, p < 0.001. Error bars correspond to standard deviation (n = 3).

