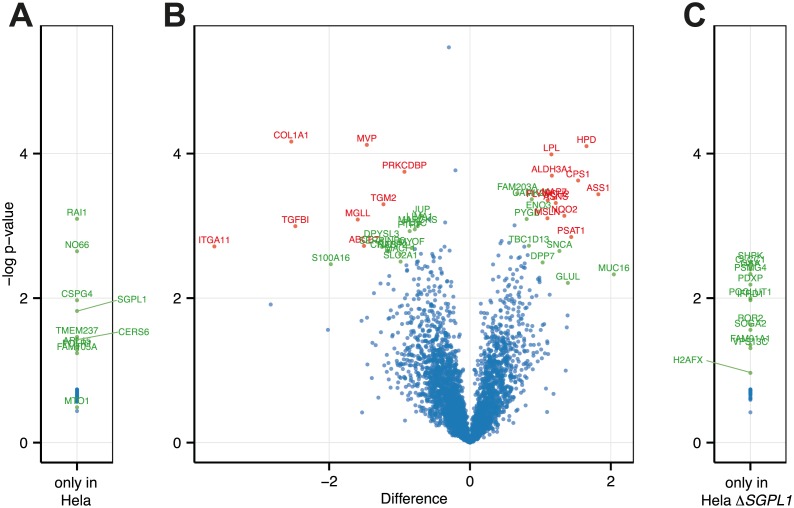
Fig 5. Proteomic analysis of the HeLa and HeLa ΔSGPL1 cell lines.
Differential expression of proteins in HeLa and HeLa ΔSGPL1 cell lines. (A and C) Proteins only found in one of the cell lines. Protein LFQ (label free quantification) intensities of HeLa (A) or HeLa ΔSGPL1 (C) cells were used to calculated T-test p-values. A list of proteins is provided in S5 and S6 Tables. (B) Volcano plot of differential expression of proteins. Difference of log transformed LFQ (label free quantification) intensities of HeLa cells and HeLa ΔSGPL1 cells (ΔSGPL1 –HeLa). Statistical analysis was carried out with Perseus software. Significance Values are based on permutation based FDR analysis [44]: Proteins scoring p < 0.05 are shown in green, p < 0.01 in red. A list of proteins is provided in the S4 Table.

