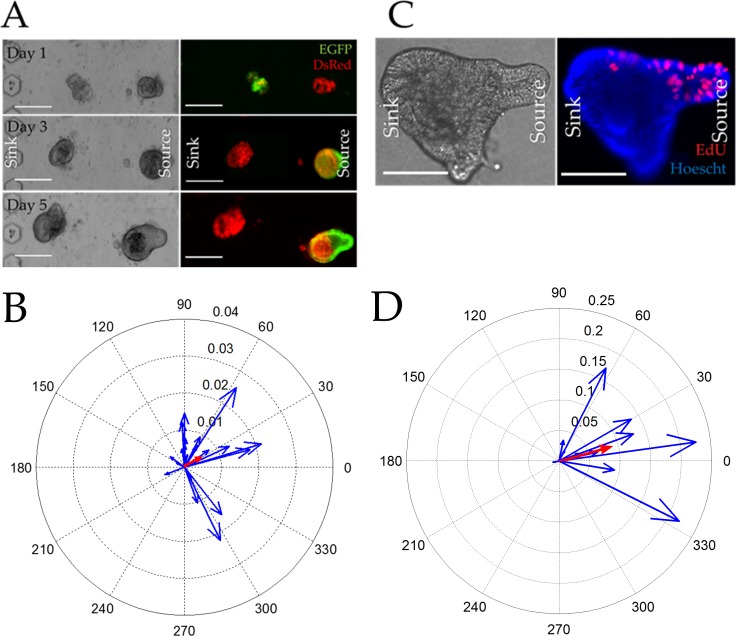
Fig 5. Colonoid growth in the presence of a dual Wnt-3a/R-spondin1 gradient.
(A) Brightfield (left) and overlaid red/green fluorescence (right) images of colonoids cultured under a Wnt-3a/R-spondin1 gradient for 1, 3, and 5 days in the microchannel. The scale bar is 250 μm. (B) Compass plot displaying the Sox9EGFP polarization magnitude and angle for individual colonoids (blue) cultured under the Wnt-3a/R-spondin1 gradient for 5 days (n = 33 colonoids from 6 microchannels). The average magnitude and angle of the vector can be seen in red. (C) Brightfield (left) and overlaid red/blue fluorescence (right) images of colonoids cultured the gradient for 5 days then pulse-labeled with EdU (red) for 2 h. Hoechst 33342 fluorescence is shown in blue. The scale bar represents 50 μm. (D) Compass plot displaying the EDU polarization magnitude and angle for individual colonoids (blue) cultured as described in (C) (n = 11 colonoids in 4 microchannels). The average magnitude and angle of the vector can be seen in red.

