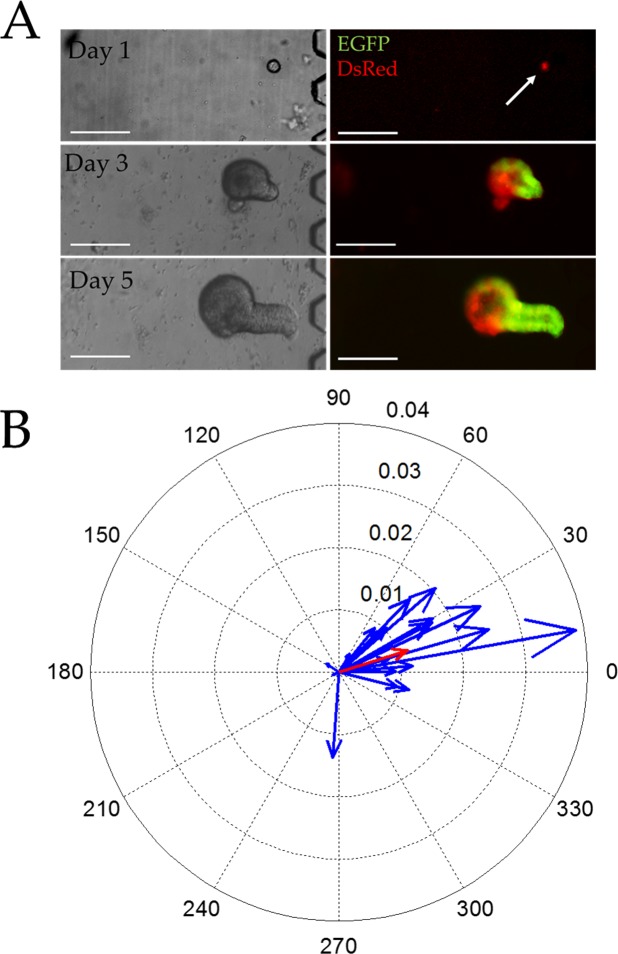
Fig 6. Growth of single stem cells in the presence of a Wnt-3a/R-spondin1 gradient.
(A) Brightfield (left) and overlaid red/green fluorescence (right) images of single stem cells cultured under a Wnt-3a/R-spondin1 gradient for 1, 3, and 5 days in the microchannel. The scale bar is 250 μm. (B) Compass plot displaying the Sox9EGFP polarization magnitude and angle for the single colonoids (blue) under the Wnt-3a/R-spondin1 gradient for 5 days (n = 23 colonoids in 5 microchannels). The average magnitude and angle of the vector can be seen in red.

