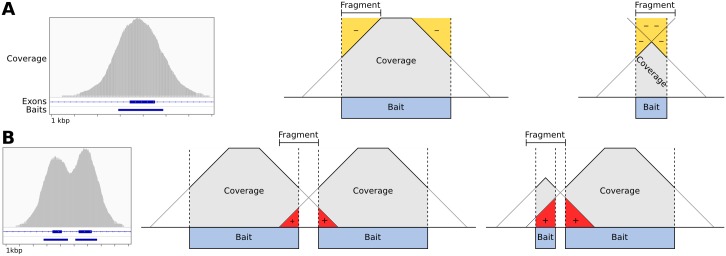
Fig 2. Baited region size and spacing affect read depth systematically.
A: Example of typical coverage observed at a targeted exon, as viewed in IGV, and simplified geometric models of the negative coverage biases (yellow) that can occur as a function of the relative sizes of sequence fragments and the baited region. B: Coverage observed at two neighboring targeted exons, and models of the positive coverage biases (red) that can occur where intervals are separated by less than half the insert size of sequence fragments.

