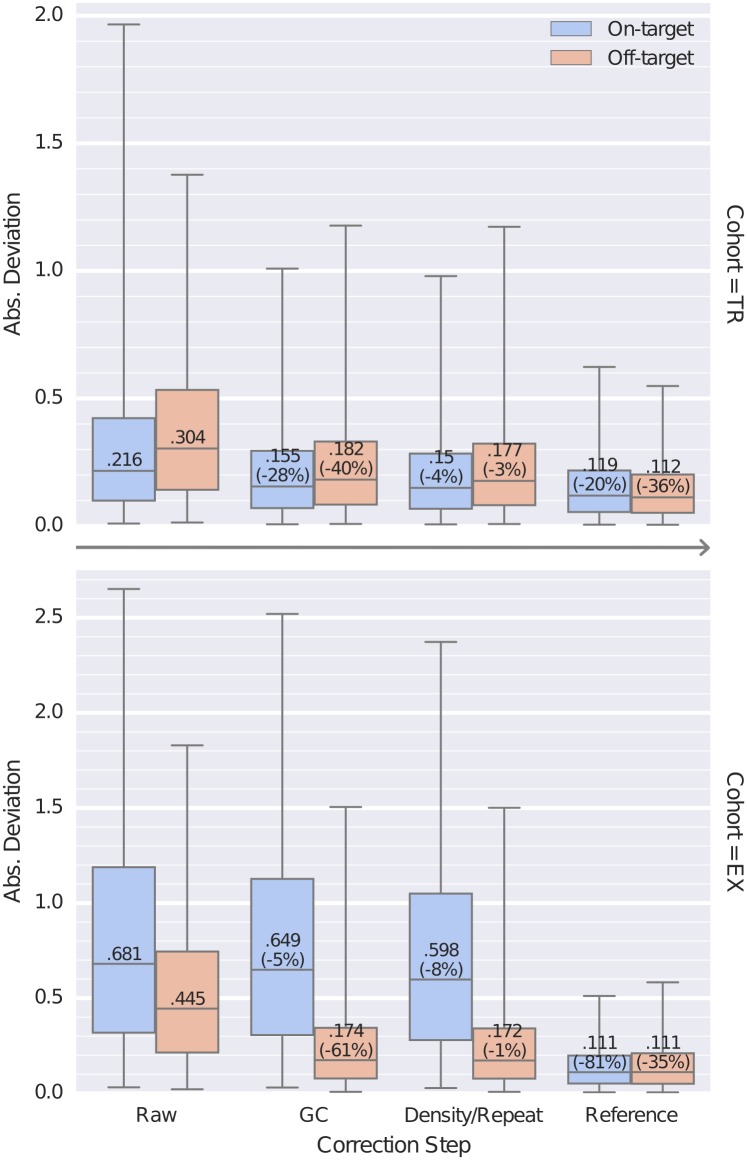
Fig 4. Bias corrections reduce the extraneous variation in bin read depths.
Distributions of the absolute deviation of on– and off-target bins from the final, segmented copy ratio estimates are shown as box plots at each step of bias correction for all samples in the TR and EX sequencing cohorts. At each step, for on- and off-target bins separately, boxes show the median and interquartile range of absolute deviations and whiskers show the 95% range. Steps shown are the initial median-centered log2 read depth (“Raw”), correction of GC bias (“GC”), correction of on-target density and off-target repeat biases (“Density/Repeat”), and normalization to a pooled reference (“Reference“).

