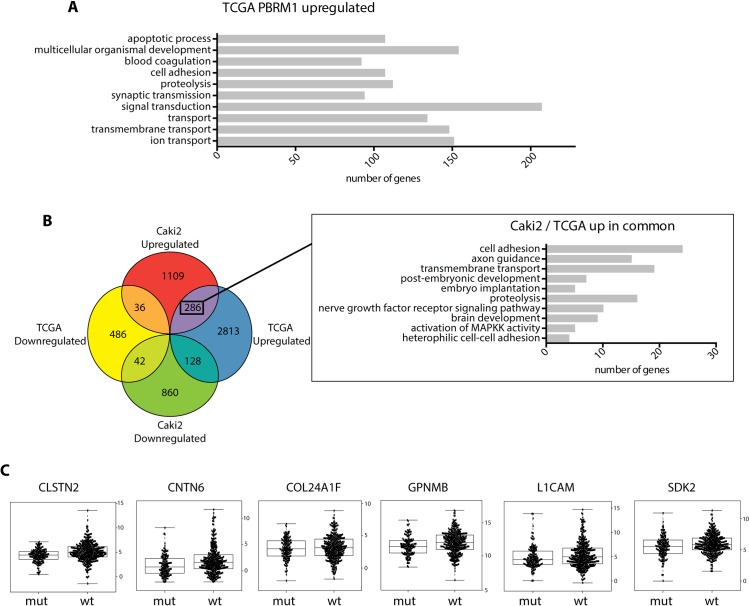
Fig 7. Comparative analysis of genes with differential expression in the presence of PBRM1 between ccRCC cells and ccRCC TCGA biospecimen.
(A) GO Biological Processes enriched by genes upregulated in TCGA ccRCC biospecimen with no PBRM1 mutation compared to ccRCC biospecimen with PBRM1 mutations. (B)Venn diagram illustrating the number of differentially expressed genes overlapping between the 2 datasets (Genes with differential expression in 1. Caki2+PBRM1 with respect to Caki2+Vector and 2. ccRCC biospecimen with no PBRM1 mutation with respect to biospecimen with PBRM1 mutations). Inset illustrates GO Biological Processes enriched by upregulated genes in both (1) PBRM1 reexpressed Caki2 cells and (2) TCGA ccRCC biospecimen with no PBRM1 mutation. (C) Box Plot showing the relative expression (log2 RSEM) of genes involved in cell adhesion in TCGA biospecimen.

