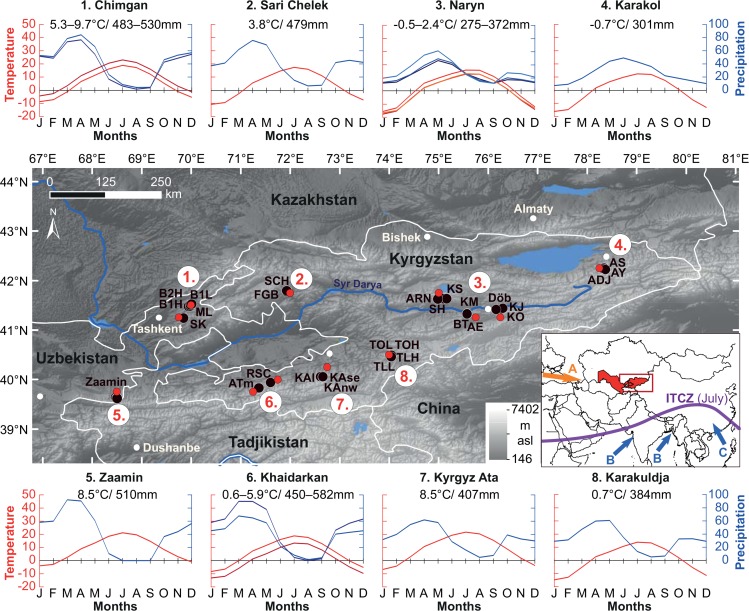
Fig 1. Juniper sampling sites (black dots) and closest CRU grid point data (red dots) in Uzbekistan and Kyrgyzstan.
Westerly winds (A; orange arrow in inset) dominate the study area causing continental climatic conditions at the sites. Climate charts show absolute annual (numbers) and monthly temperature means (red shades) and precipitation sums (blue shades) for all CRU grid points for each region over the period 1961–1990. Monsoonal influences (blue arrows) are depicted for the Indian Summer Monsoon (B) and East Asian Summer Monsoon (C), respectively, while ITCZ stands for Intertropical Convergence Zone (purple line; after Lutgens and Tarbuck, 2001 [31]). Topographic features are indicated by digital elevation model data in grey colors.

