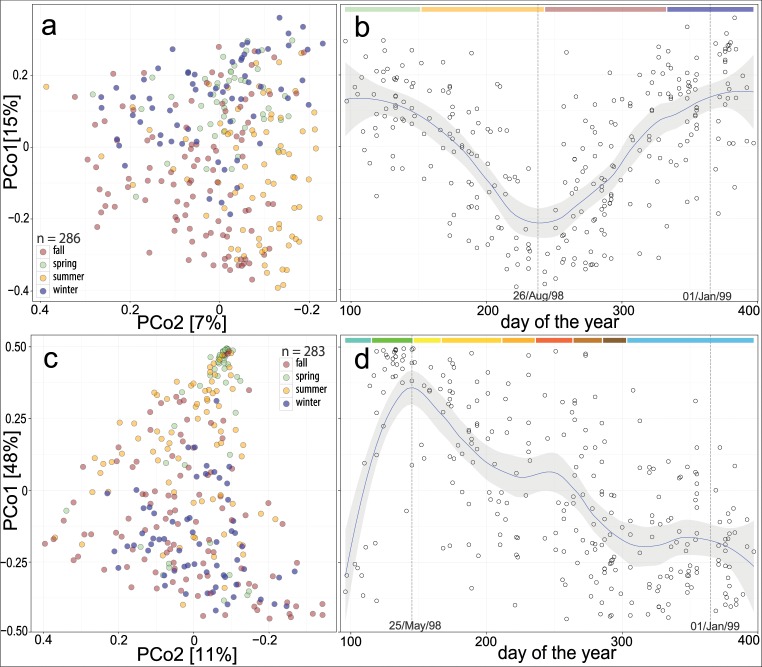
Fig 1. Microbial community variation and temporal dynamics.
Points: dust samples from different homes. (a, c) first coordinates of a principal coordinate analysis (PCoA) on Bray–Curtis dissimilarities of the fungal (a) and bacterial (c) communities; in brackets: explained variance, colours: meteorological seasons. (b, d) the principal coordinate that explains most of the variation for fungi (b) or bacteria (d) sorted by the sampling date; regression (b, d): a locally weighted polynomial fit with 95% confidence interval; coloured bars at the top of (b): meteorological seasons: spring, summer, autumn, and winter; coloured bars at the top of (d): plant phenological periods of the geographic area during the time-frame of sampling: early spring (beginning March 16, 1998), full spring (April 25), early summer (May 26), midsummer (June 16), late summer (August 1), early autumn (August 26), full autumn (September 23), late autumn (October 15), and winter (November 3) (dates obtained from: http://www.dwd.de/, http://www.phenocal.chira.de; accessed 18 Jul 2014).

