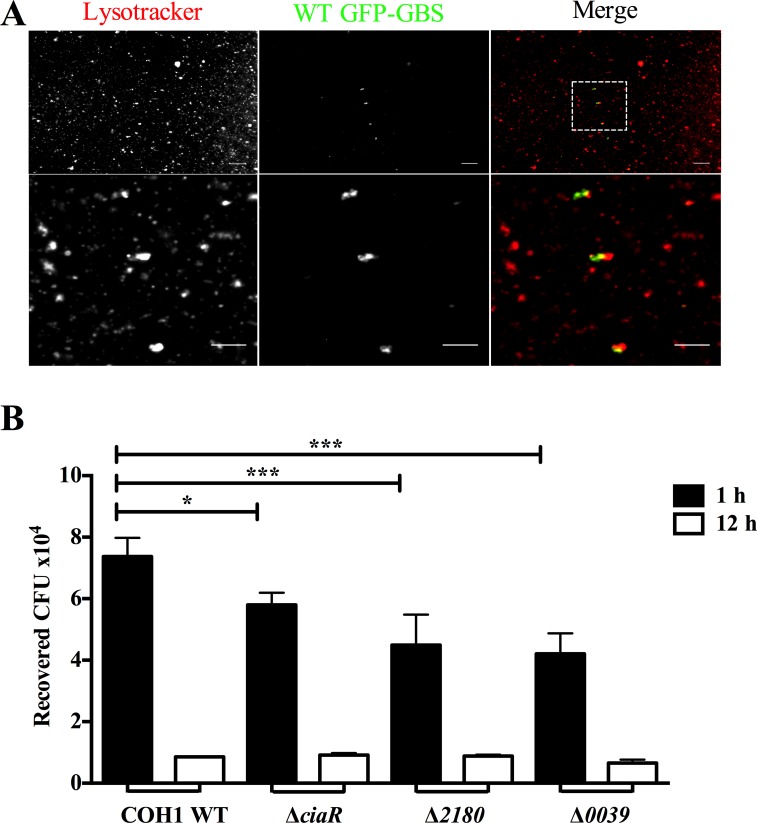
Fig 4. GBS recovery from Lysosomes.
A. Isolated lysosomes infected with WT COH1 GFP expressing GBS were subjected to staining with Lysotracker Red (0.5μM) and visualized using fluorescence microscopy. Scale Bar, 5 μm B. hBMEC were infected with WT or mutant GBS strains for 2 hours (MOI = 10) and subjected to lysosomal isolation by differential centrifugation after 1 or 12 hours post antibiotic treatment. Lysosomal pellets were plated to enumerate the amount of recovered viable CFU. Statistical analysis performed was a One-way ANOVA with a Tukey’s multiple comparisons test and the data represents mean ± S.D. p < 0.05 *, p < 0.005 **.

