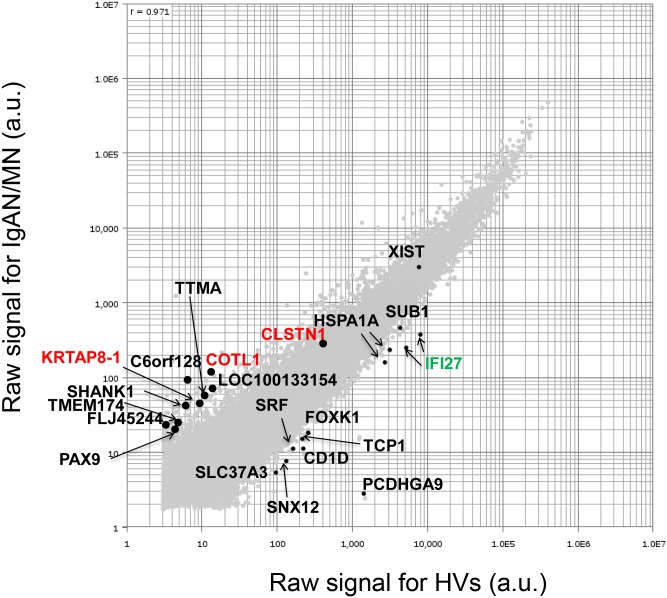
Fig 2. Microarray expression profiling.
Scatter plot for genes highlighted in red front in Fig 1. DNA microarray data, expressed as log of signal intensity of IgAN/MN vs HVs, are plotted along the vertical and horizontal axes, respectively. Horizontal or vertical axis indicates the raw signal intensity of IgAN/MN or HVs (arbitrary units: a.u.), respectively. CLSTN1, COTL, KRTAP8-1, and IFI27, which were subjected to qRT-PCR analysis, are highlighted in red or green font.

