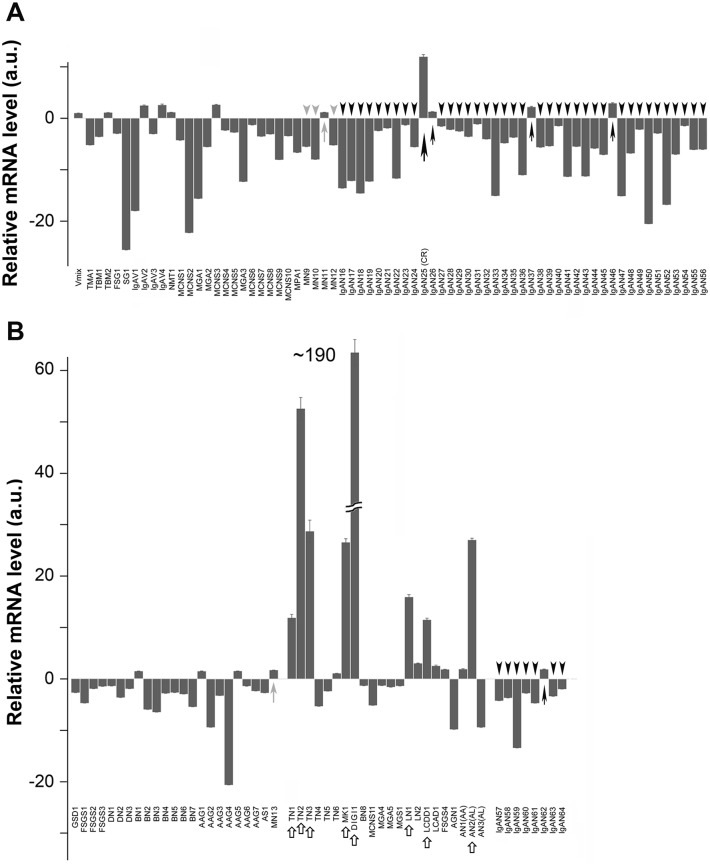
Fig 4. Relative IFI27 mRNA levels of individual patients suffering from the indicated kidney diseases.
(A, B) Box graphs show relative IFI27 mRNA levels, determined by qRT-PCR, for the indicated patients. Horizontal axis indicates the mRNA level (arbitrary units: a.u.) relative to the value in HVs, which was fixed at 1.0 a.u. Black and gray arrowheads indicate IgAN and MN patients whose IFI27 mRNA levels were lower than those of HVs (Vmix). Black and gray arrows indicate IgAN and MN patients whose IFI27 mRNA levels were slightly elevated. A large black arrow indicates an IgAN25 patient who had entered complete remission at the time of blood sample collection and who had a high IFI27 mRNA level. White arrows indicate other patients who had high IFI27 mRNA levels.

