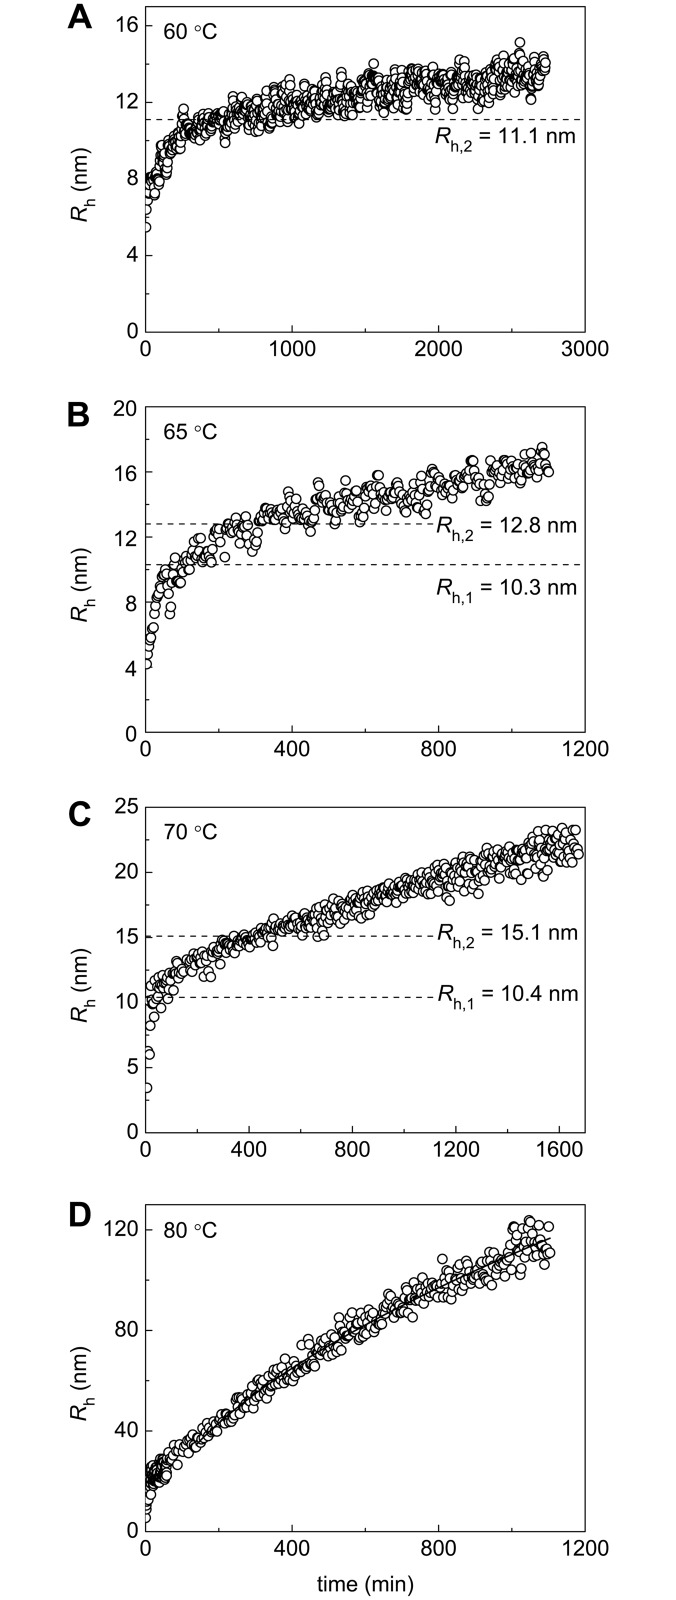
Fig 7. Dependences of the hydrodynamic radius (Rh) on time for aggregation of BSA at (A) 60°C, (B) 65°C, (C) 70°C and (D) 80°C.
The dotted horizontal lines on panels A, B, and C correspond to Rh,1 or Rh,2 values calculated from the dependences of Rh on the portions of denatured and aggregated BSA, respectively. The solid curve on panel D was calculated from Eq 3 at df = 1.76.

