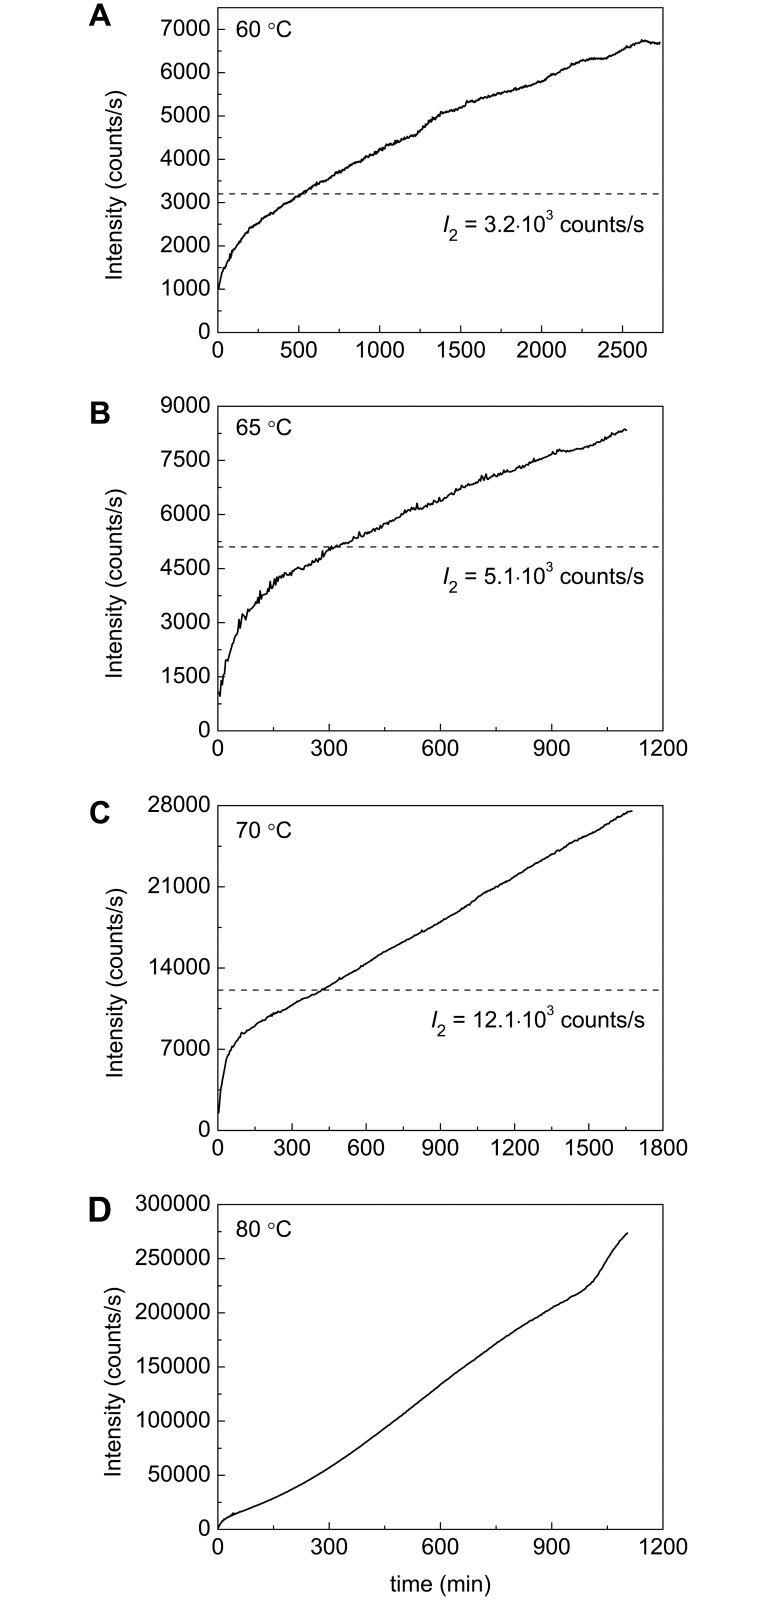
Fig 10. Dependences of the light scattering intensity on time for aggregation of BSA at (A) 60°C, (B) 65°C, (C) 70°C and (D) 80°C.
The dotted horizontal lines on the panels A, B and C correspond to I2 values calculated from the dependences of the light scattering intensity on the portion of aggregated BSA.

