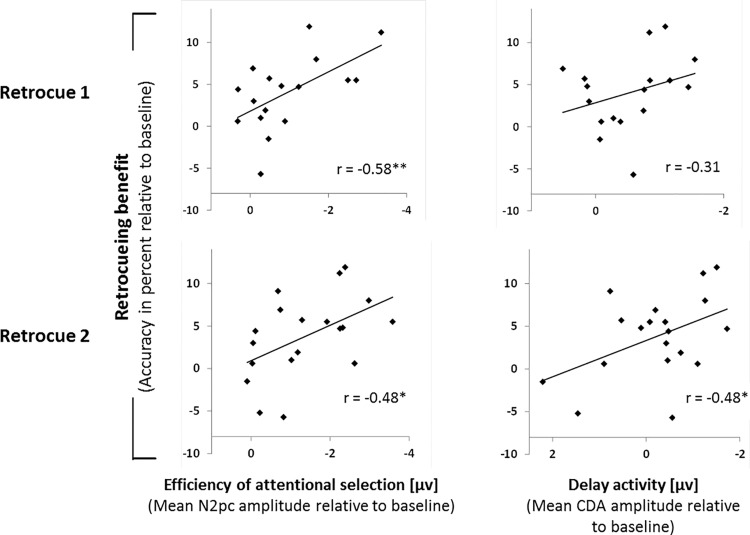
Fig 4. Correlations between behavioural and ERP results.
The first column shows correlations between N2pc amplitude and accuracy results, and the second column correlations between CDA/SPCN amplitudes and accuracy results. For correlations in the top row, ERP measures were calculated from the time windows following the first retrocue, for correlations in the bottom row, ERP measures were calculated from the time windows following the second retrocue. All measures were computed for the Add1 condition and relative to baseline, i.e. the value of each measure in the neutral condition was subtracted from the value of the respective measure in the Add1 condition.

