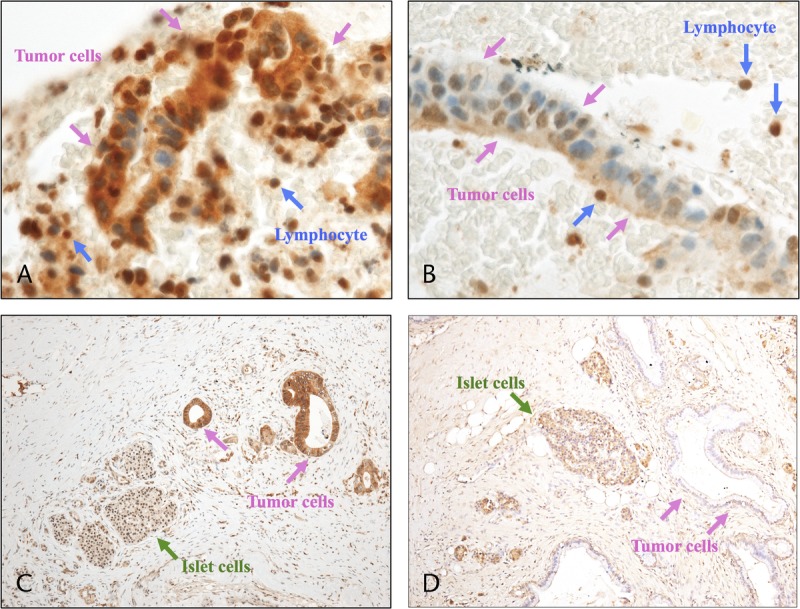
FIGURE 2.

Immunohistochemical staining of PDAC for hENT1. A, EUS-FNAB sample showing high hENT1 expression relative to internal control (lymphocyte), “hENT1 positive.” B, EUS-FNAB sample showing low hENT1 expression, “hENT1 negative.” C, Resected specimen showing high hENT1 expression relative to internal control (islet cells), “hENT1 positive.” D, Resected specimen showing low hENT1 expression, “hENT1 negative.”
