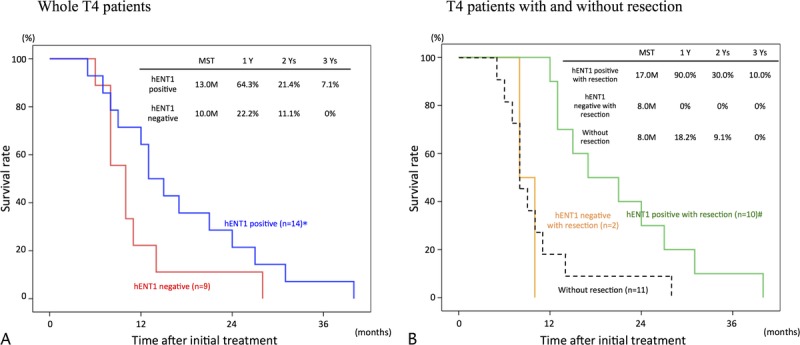
FIGURE 5.

Cumulative survival curves in T4 patients according to hENT1 expression. A, Whole T4 patients comparing hENT1 positive (n = 14) and negative (n = 9). B, T4 patients with resection comparing hENT1 positive (n = 10) and negative (n = 2), and those without resection (n = 11). *P = 0.126 versus hENT1 negative. #P < 0.001 hENT1 negative with resection.
